Silence in Your Data Stream Is a Silent Compliance Risk
For most fuels and CDR operators, closing out a month's data package is a sign that everything has been collected. But imagine a scenario where you’ve closed out the month’s reporting, your data dashboard shows zero errors, and everything looks clean. However, under the hood, a routine gateway update silently cut off your plant’s methane analyzer for 72 hours - wiping out nearly 300 expected data points. Standard data rules validate values as they arrive, but when a sensor drops offline, there’s no bad data to flag. The silence looks like success.
Fast forward to reporting season: an auditor points to the three-day gap in methane analysis and asks what happened.
Suddenly, your team is scrambling through months of old server logs and email chains to piece together what went wrong. Worse, under regulatory programs like California’s Low Carbon Fuel Standard (LCFS), missing data forces you into conservative fallback methods, costing you value on your credits.
This is why tracking your data capture rate (the percentage of expected measurements actually received against your reporting schedule) is just as vital as checking data accuracy.
To eliminate these blind spots, Mangrove built automated data completeness tracking directly into the platform, giving you instant visibility before a missed transmission becomes a compliance headache.
See how complete your data are
To configure this feature on Mangrove, set the expected reporting frequency for each device, such as every 15 minutes, hourly, daily, or as dictated by the equipment. This is referred to as the cadence. Cadence works the same way for a biochar kiln's temperature log or the injection flow meter on a BECCS site. Monthly values work too, like an invoice or a utility bill. Irregular data flows that don't follow a set cadence, such as shipments or lab results, are excluded from the data capture rate.
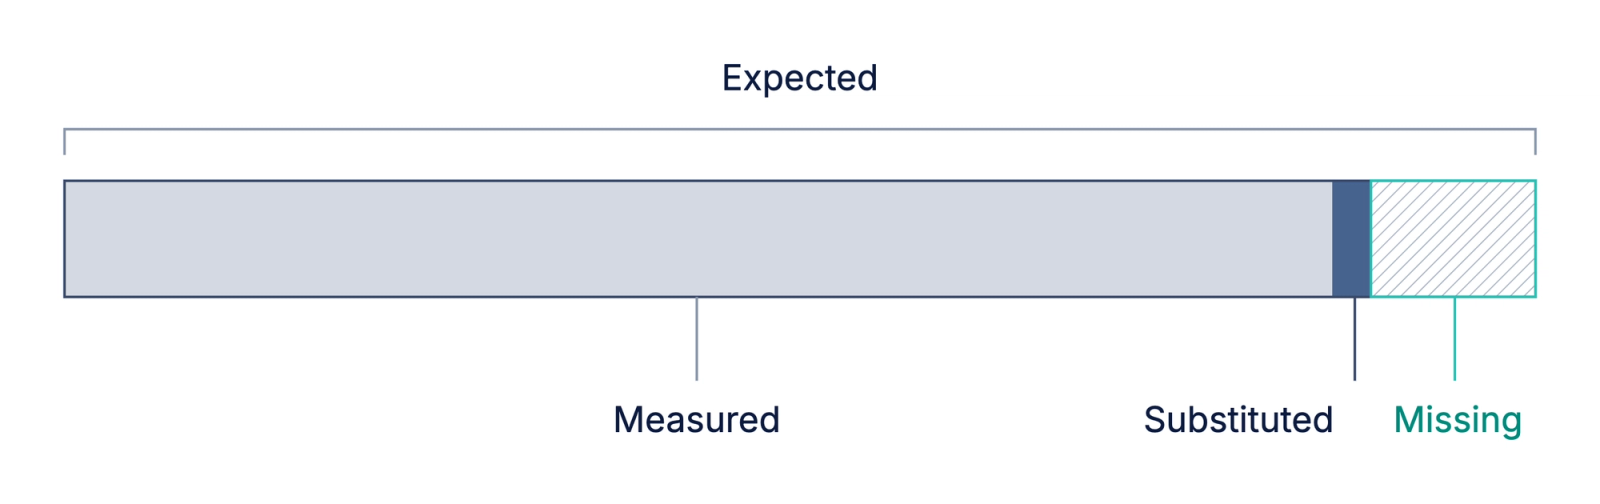
Data completeness is divided into three categories: measured, substituted, and missing. Only raw, measured values contribute to the capture rate. Values that are substituted are counted separately, and you can click each substitution to inspect by individual value and origin.
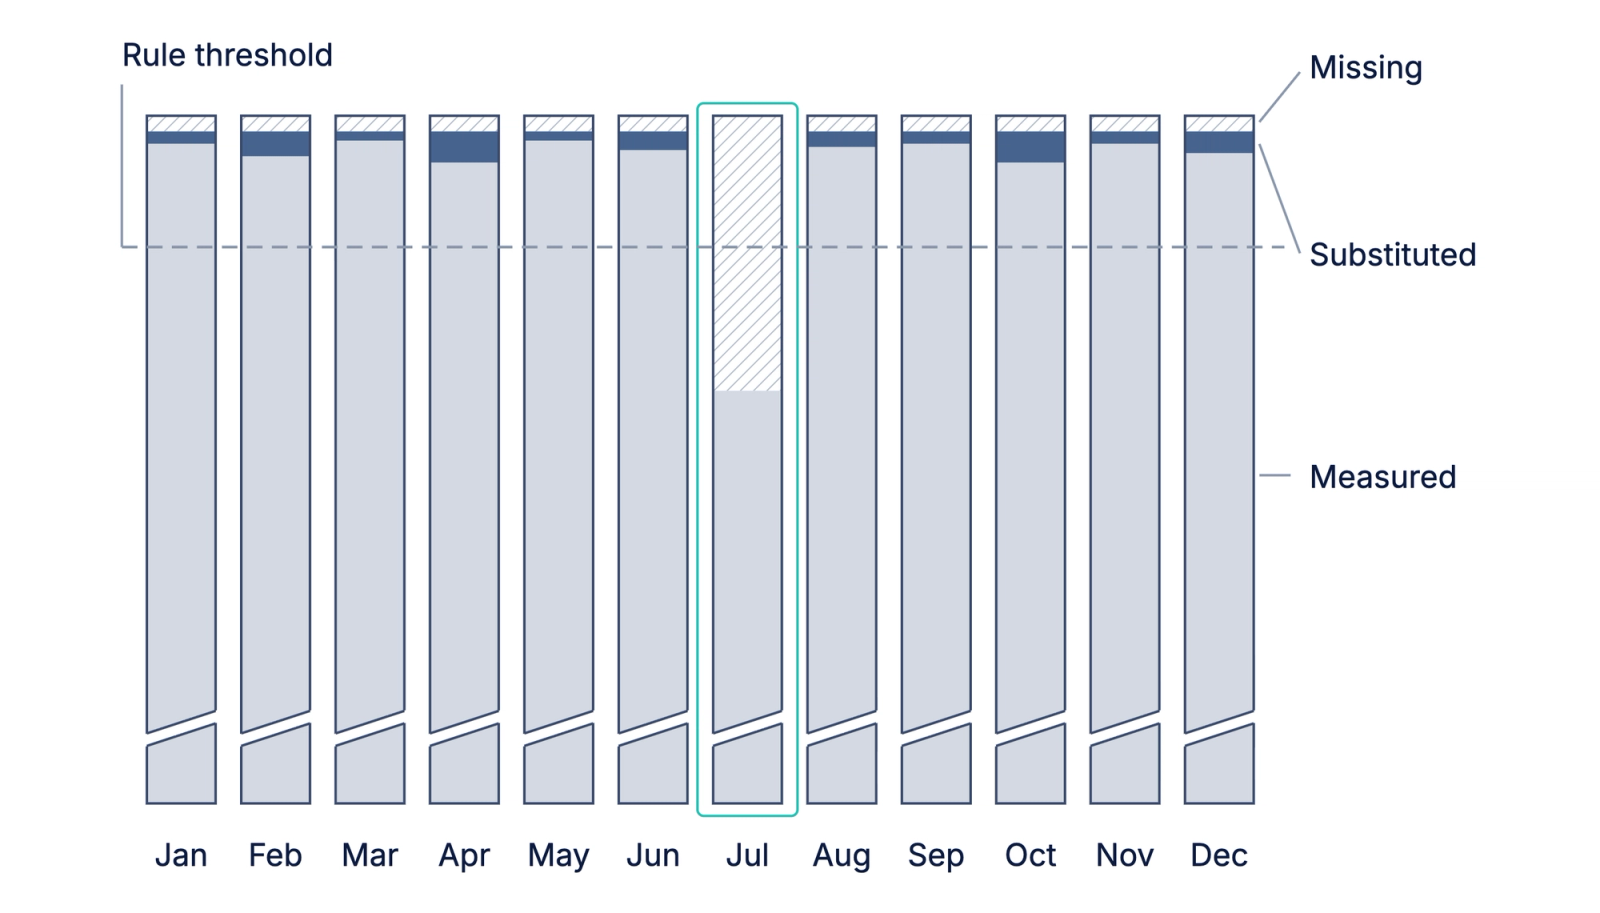
The annual overview displays twelve monthly columns showing data breakdown across all three categories. A large missing block in July highlights a data gap, and a user can drill into this time period to further inspect where data were not captured.
Write data rules on missing data
For any data rule with a set cadence, you can measure what share of expected values were actually collected. DATA_CAPTURE_RATE returns the capture rate for a month or a year as a number from 0 to 1. The rule below shows how the platform will provide alerts if the methane analyzer captured less than 95% of what the month expected.
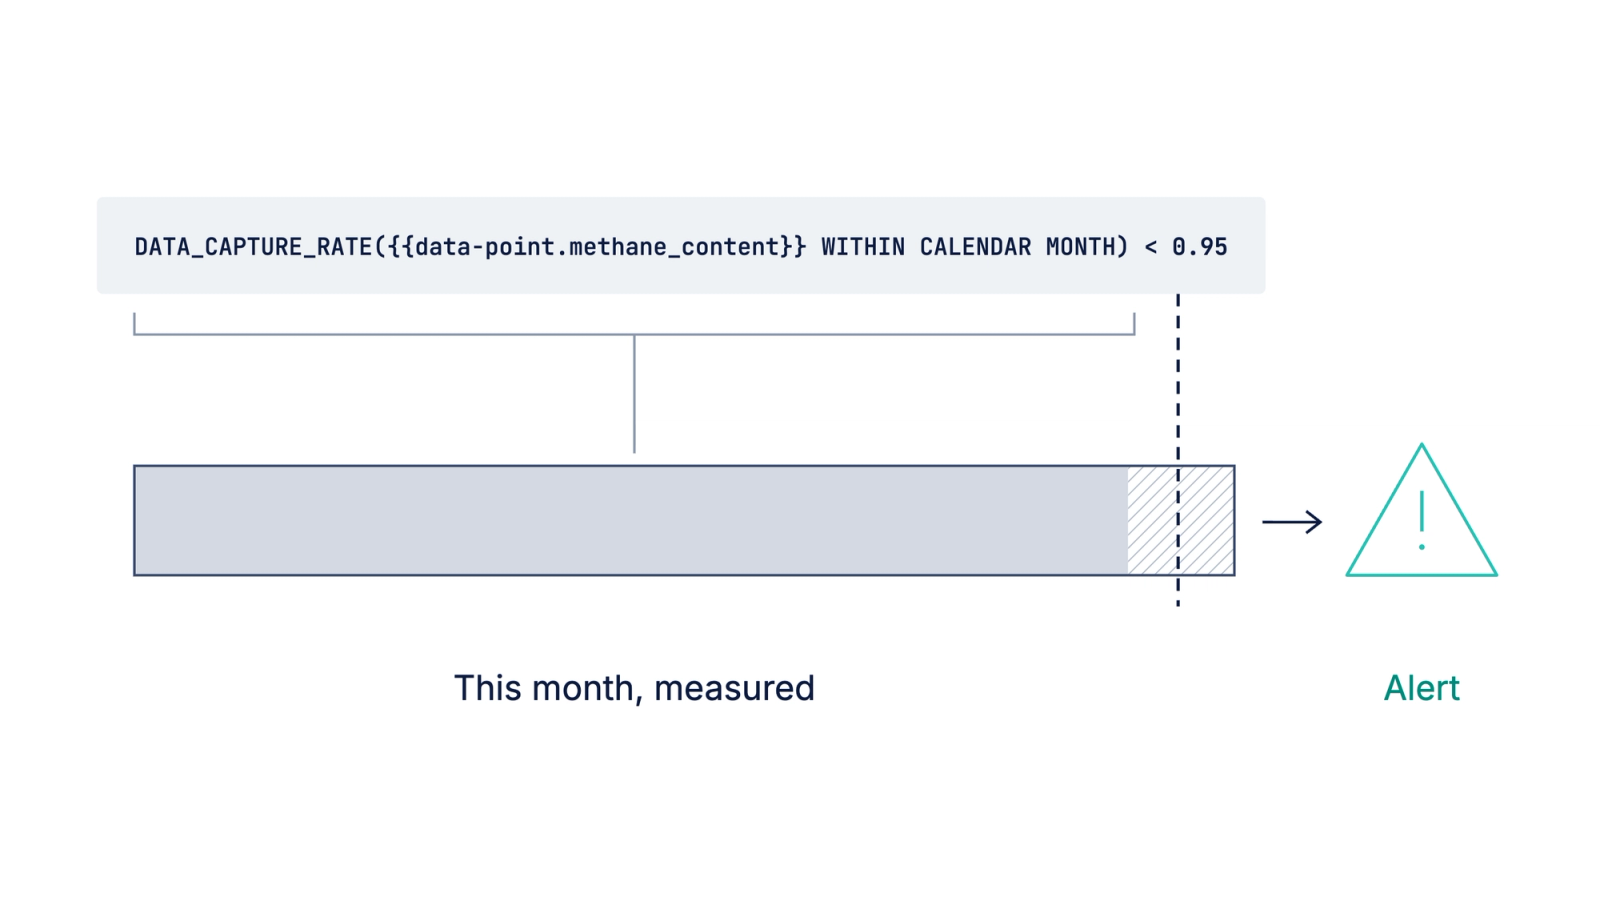
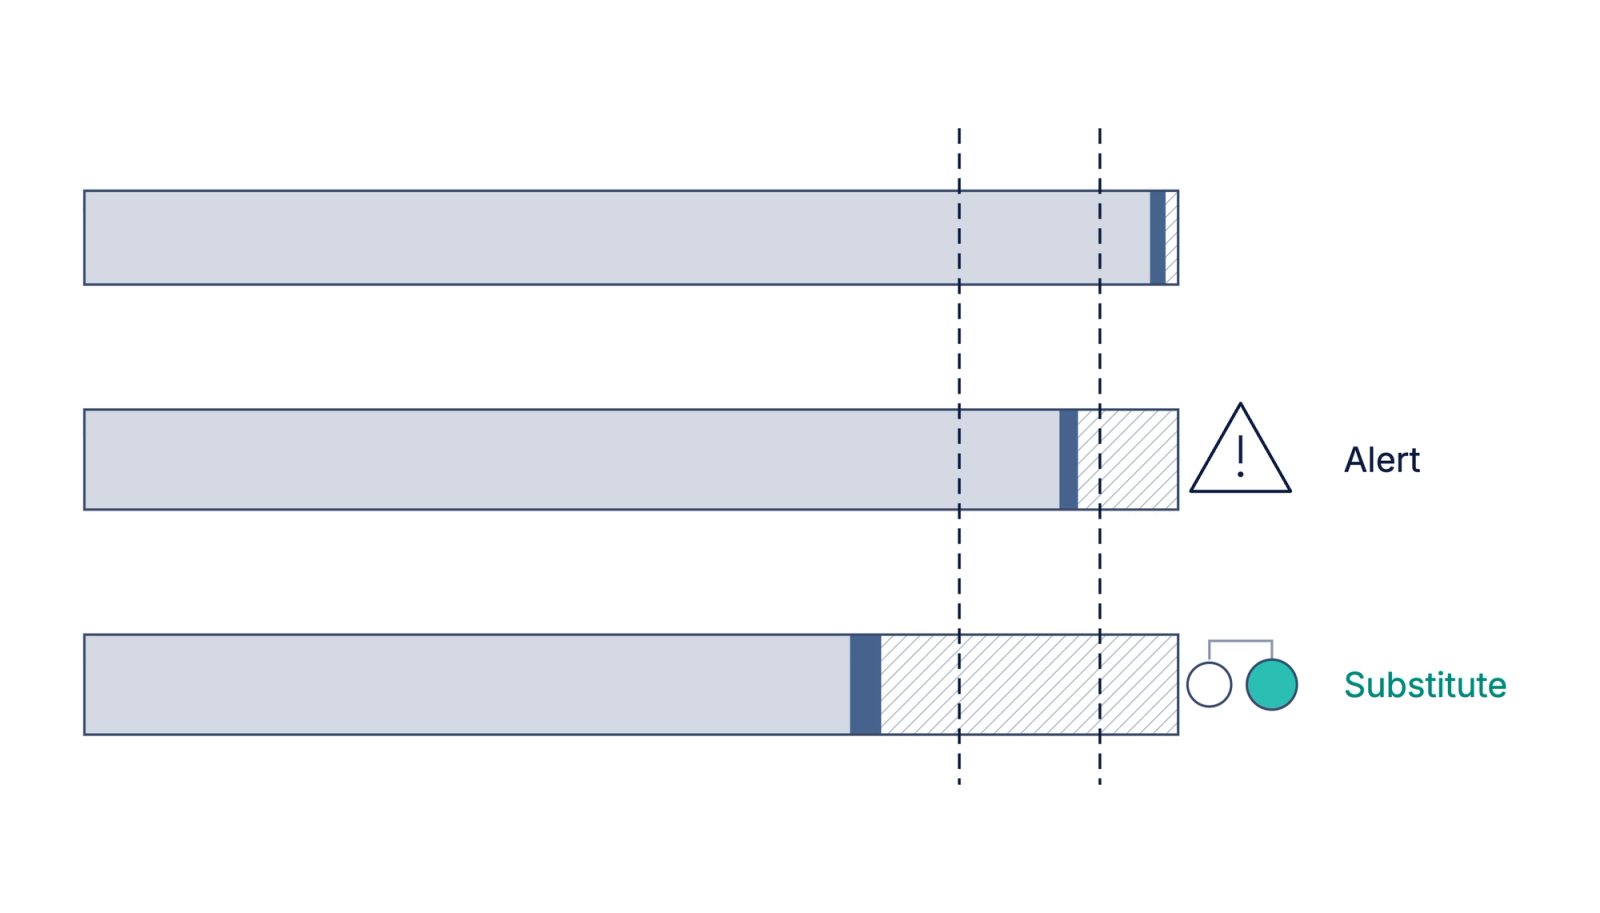
In the methane analyzer example, the three-day gap drops the monthly capture rate to 90%. Since the rule is set to alert below 95%, it triggers as soon as the analyzer comes back online, weeks before anyone would open the annual report.
Apply a second rule to handle larger gaps. You can layer multiple rules on the same capture rate threshold. For instance, a minor drop triggers an alert, while a larger drop automatically fills the missing period with an estimate. The system applies whichever conservative estimation method your compliance program requires for that rate. Some programs, including LCFS, tie the method to how much data were captured. You pick the period the rule runs over. It reads the capture rate on the raw meter, then writes its estimates into the reported total that meter feeds. Your auditor sees each filled value marked as an estimate, and which rule wrote it.
Already on Mangrove? The full syntax is in the rule expression reference, and setup is in the data capture rate guide.
See your own capture rate
New to Mangrove? Book a demo and we'll walk through how capture rate can protect your projects’ monetization.