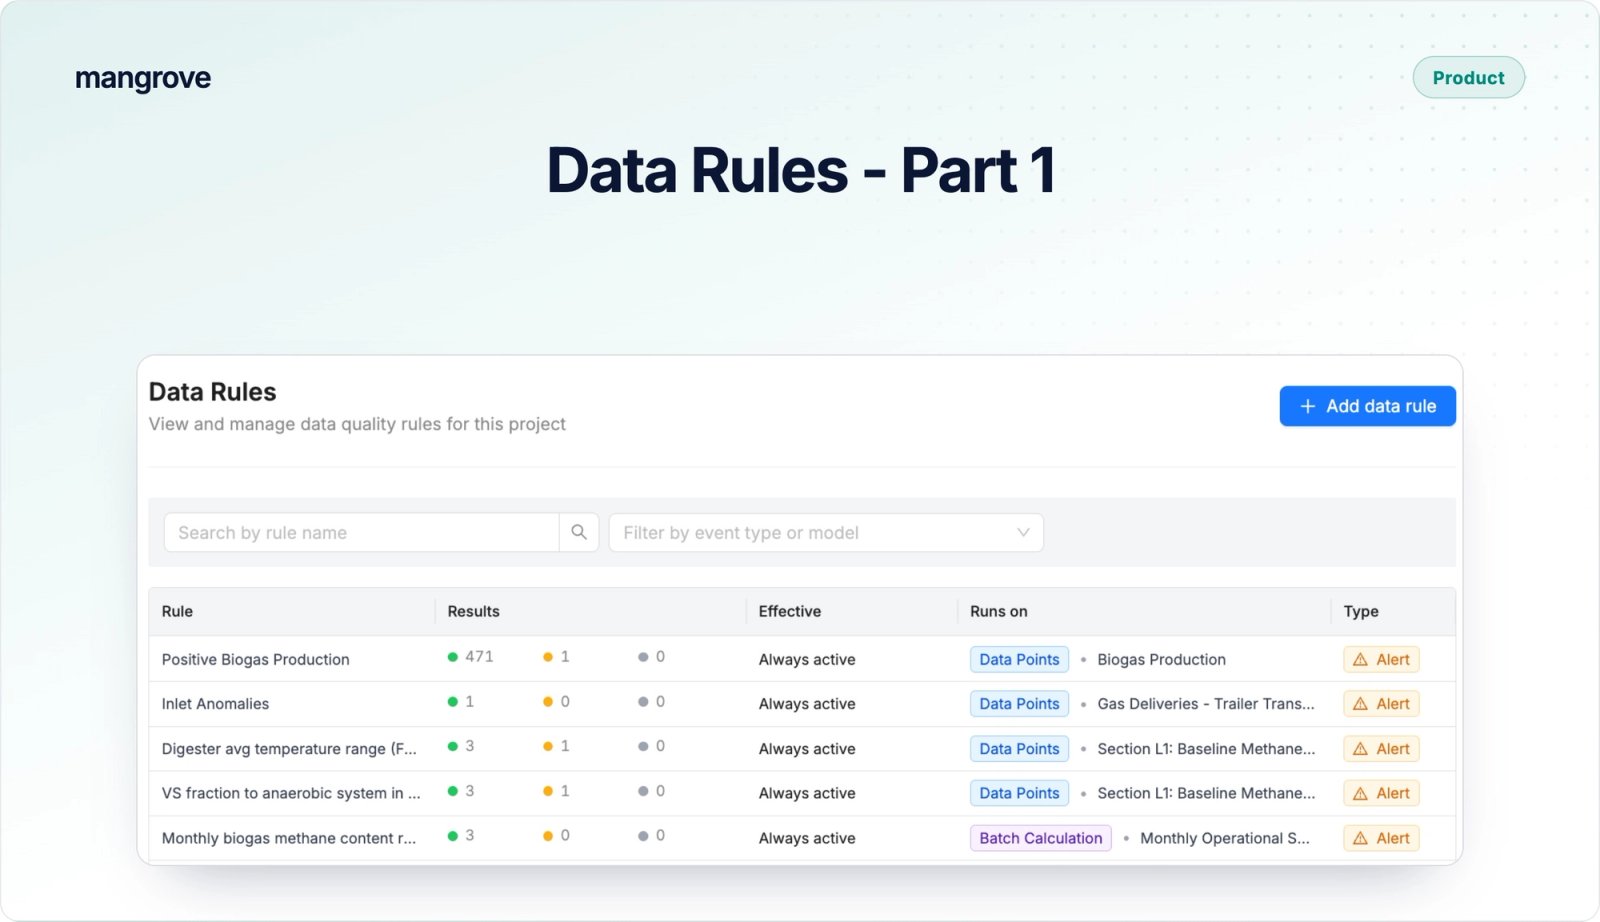
A methane reading of 0.38 looks unremarkable buried in a spreadsheet of four hundred rows. A missing meter stamp for an afternoon's biogas flow easily gets lost in the shuffle, and an unusually high hydrogen to organic carbon lab result rarely sets off immediate alarms. Nobody catches these anomalies during the monthly review, because human eyes aren't built to scan thousands of isolated data points. They sit quietly in the file when the report goes out, and the very first person to notice them is your verifier.
That is where the cost lands. A clarification request, a corrective action, another round of review, and an issuance that slips a month while everyone re-checks a number that was wrong the day it was measured. This doesn't just eat into your team's time; it delays monetization and chips away at verifier trust.
Every project already knows which checks would have caught the problem. They live in someone's head, in a spreadsheet column, or in a habit that works right up until volume grows or the person who knows the thresholds goes on leave. Mangrove's Data Rules put those checks in the platform as part of our Assurance feature set, so they run on every reading without anyone needing to remember them.
What Data Rules are: automated data quality checks
Data Rules are automated, customizable data quality checks built directly into Mangrove. Whether you are reporting renewable natural gas under LCFS, fuel production for RFS and 45Z, or biochar removals to a registry, you can set precise thresholds to define exactly what constitutes an anomaly. Mangrove continuously scans all historical and incoming data against your custom rules, instantly flagging discrepancies and alerting your team.
Create your first data rule in three steps
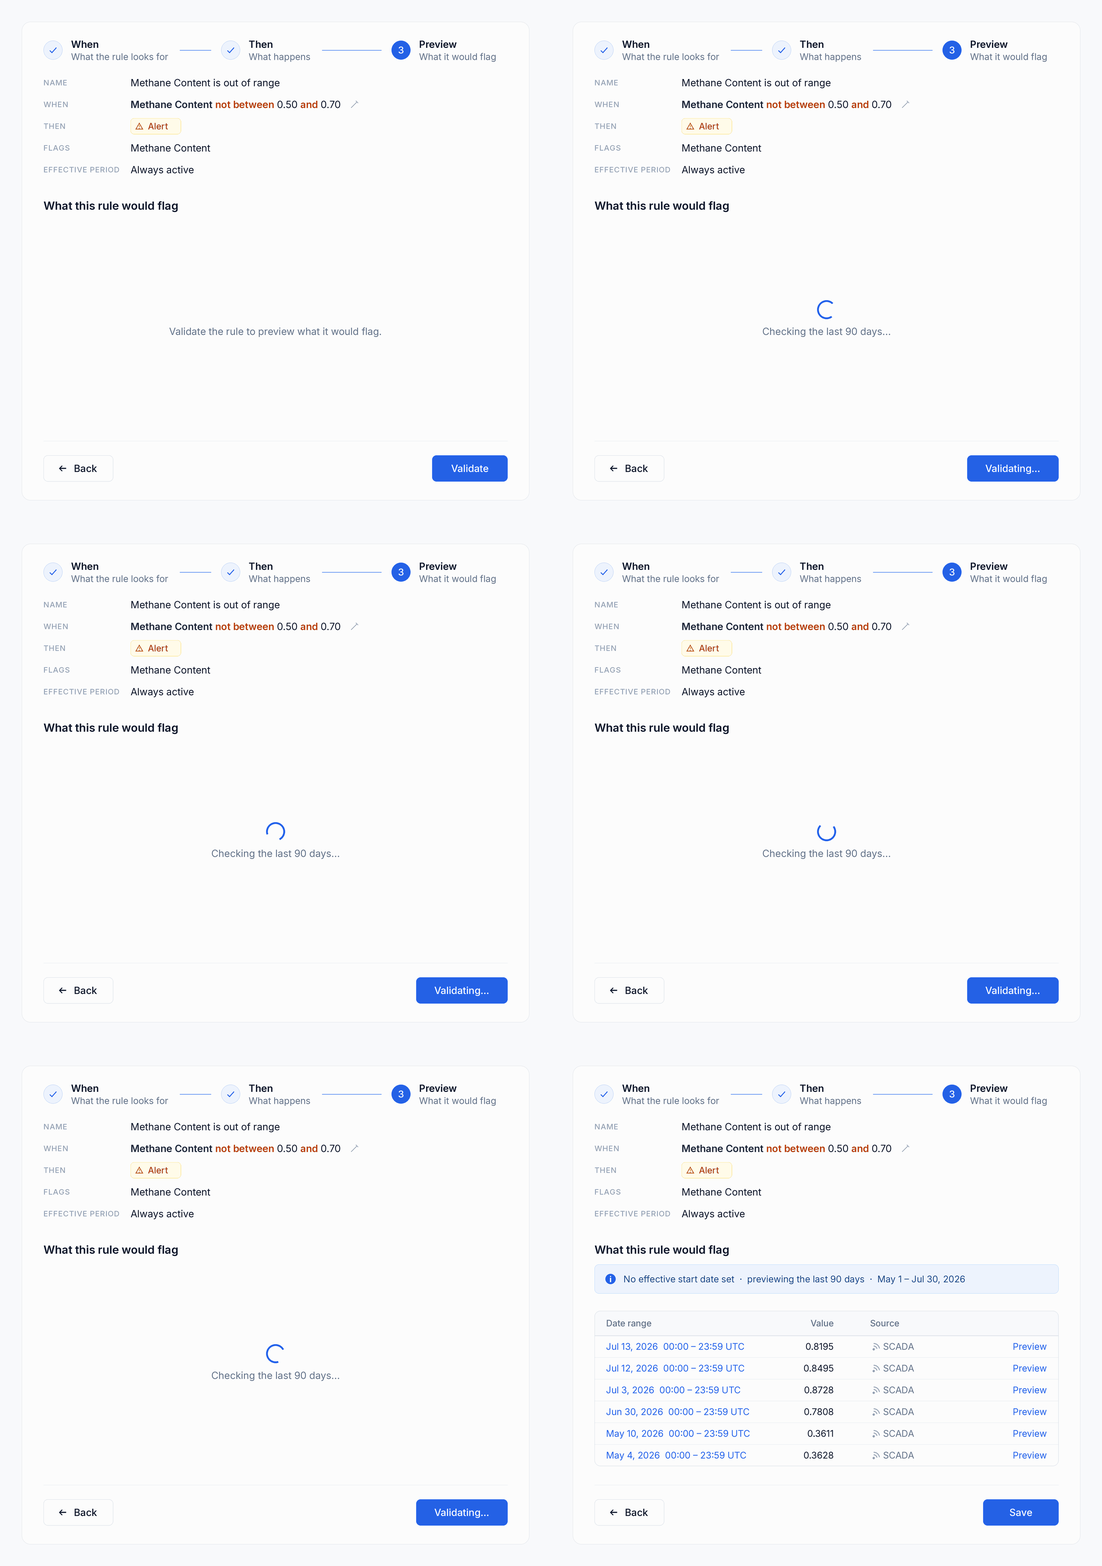
Building custom logic shouldn't require an engineering degree. There is nothing to code or script. Anyone on your team with project access can build a rule for individual data points or batch calculations through an intuitive visual interface. You simply define the When (the condition or threshold), set the Then (the alert to trigger), and hit Preview to see exactly how the rule impacts your historical data before taking it live.
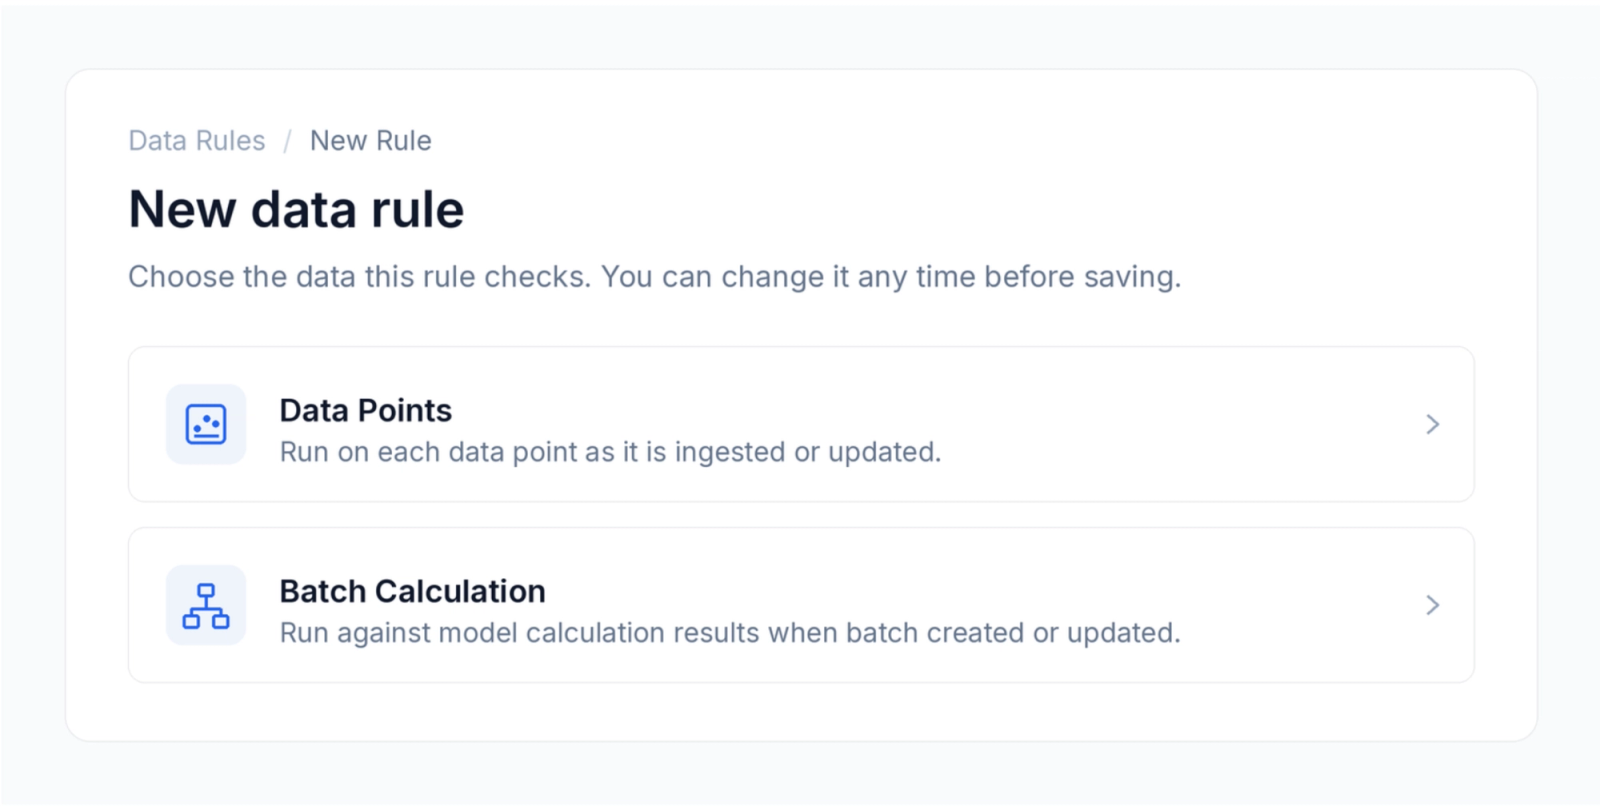
When: define what an invalid reading looks like
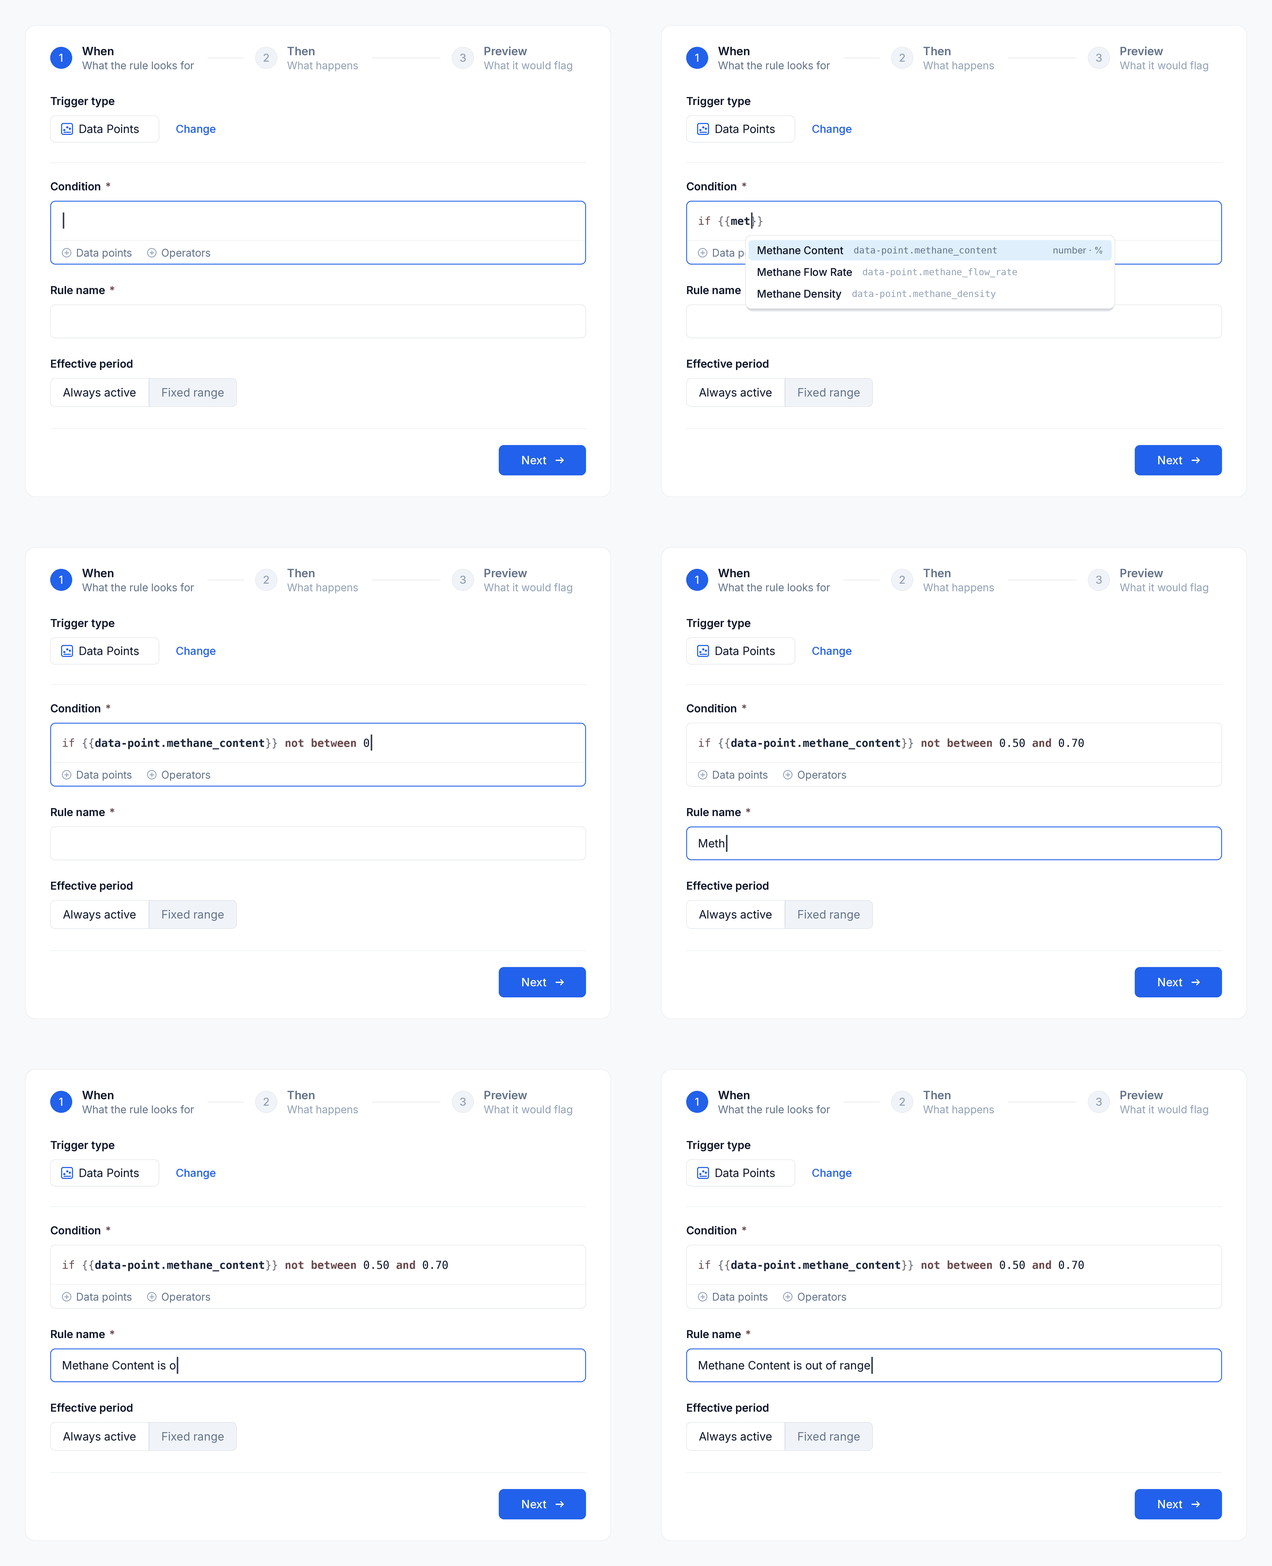
Setting up your trigger criteria is as simple as selecting a data point and defining the boundary. For example, if your methane content normally sits between 0.50 and 0.70, you want to flag anything outside that range. The logic takes just one line:
if {{data-point.methane_content}} not between 0.50 and 0.70
The rule reads almost exactly how you would say it out loud. As you type, the smart editor automatically suggests your project’s specific measurements and provides a drop-down menu of operators—like "not between" or "less than"—for easy selection. There are no complex field names to memorize and no syntax to look up. You can even apply a custom date range to a rule, ensuring it only runs during periods when a specific methodology version is active.
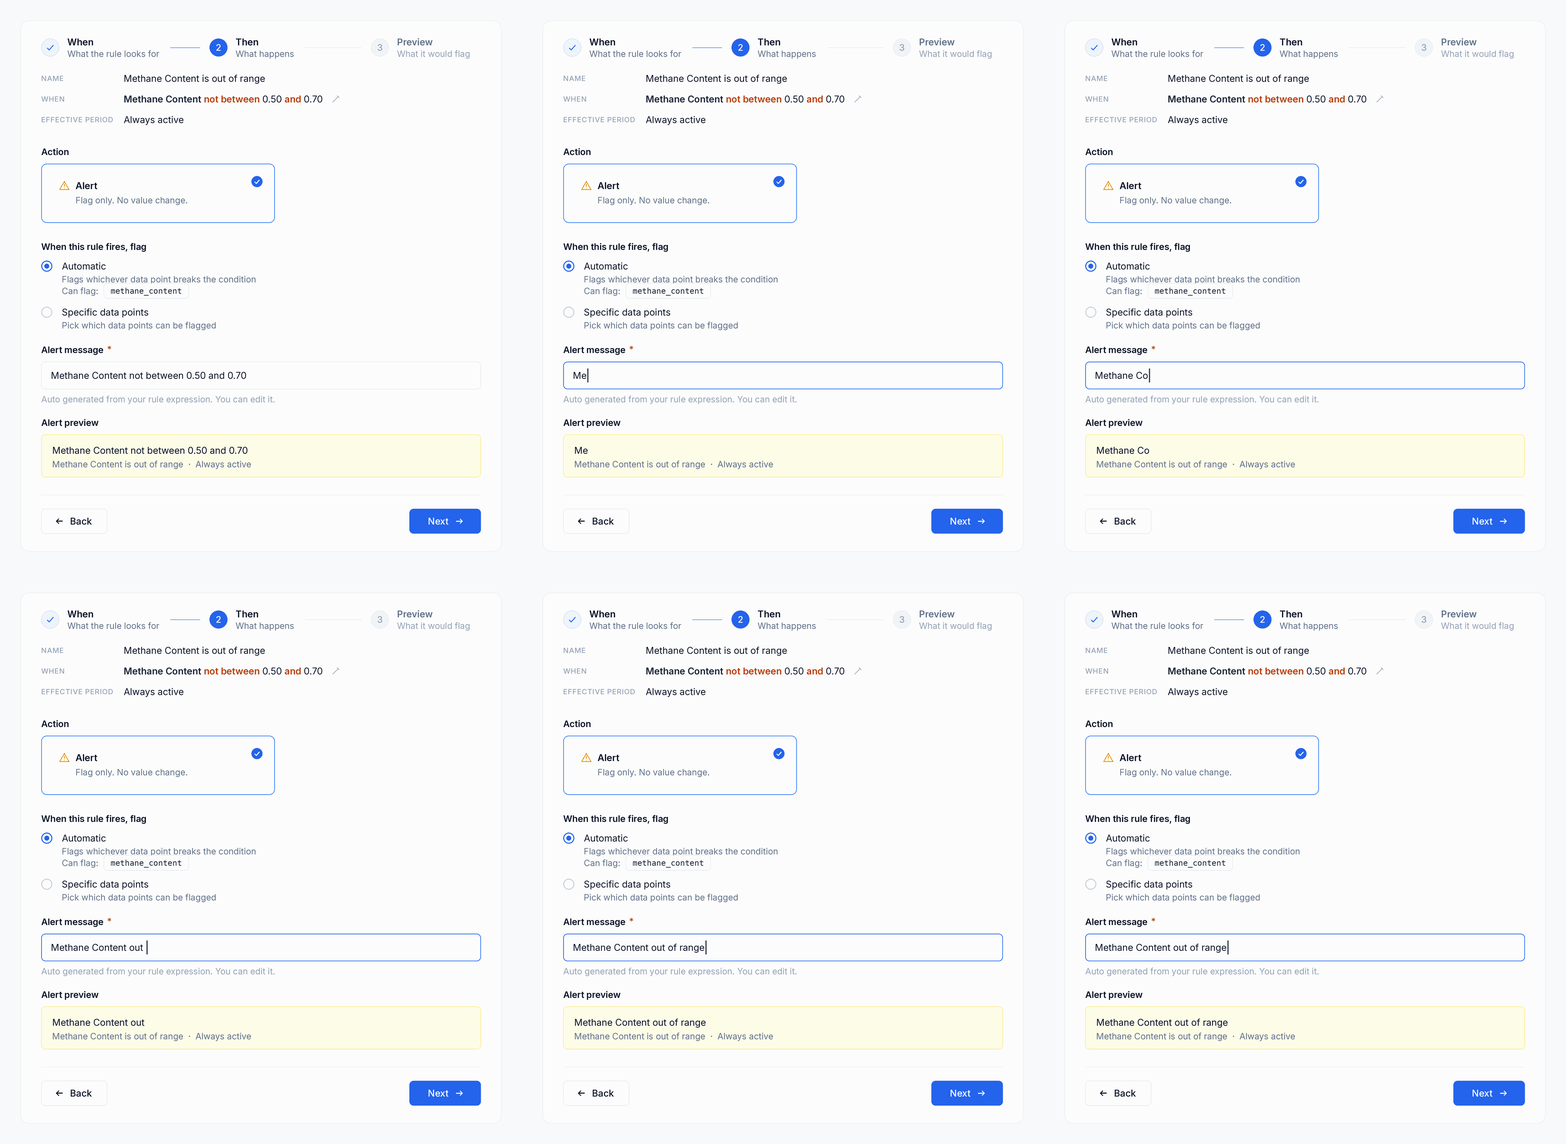
Then: choose the alert the rule raises
A triggered rule raises an alert that you can precisely direct and customize to maintain strict quality assurance. Context matters in the field: a rule monitoring two blowers should flag the exact machine that breached so your team never has to guess. To help with this, Mangrove auto-generates an initial message based on your rule's logic, which you can easily rewrite into plain text. The result? The person reviewing the anomaly three weeks later gets clear, actionable human context rather than a generic system error.
Preview: see what a rule catches before you save it
Before the rule goes live, Mangrove runs it against your data and shows you exactly what it finds, providing a clear pass/fail rate across your historical data or a specific time range. You see the actual records flagged from your specific project before anything is saved to validate the rule accuracy. If it returns too many matches, the rule may be too broad, so you can narrow it and check again. An empty list simply means your data is clean on that metric, and the rule will stand guard over new readings. Either way, the preview step lets you know exactly what you are switching on before you do it.
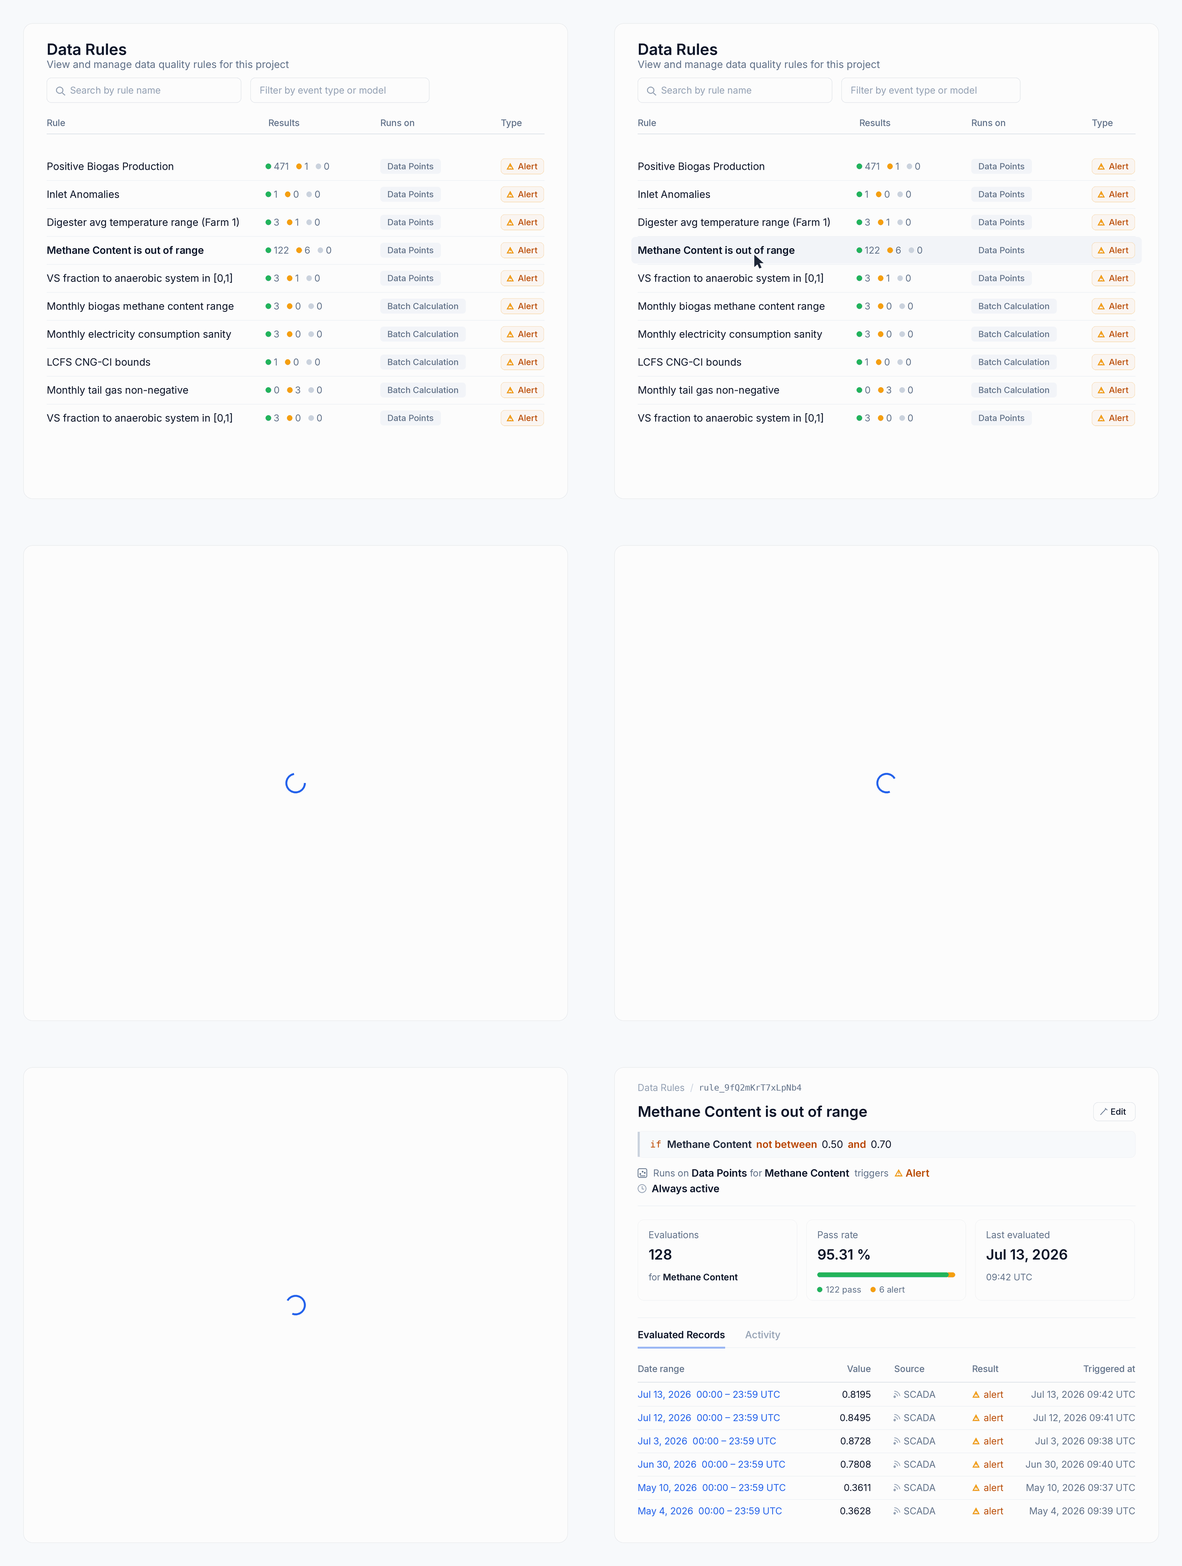
Once saved, the rule doesn't just watch future data. It looks back across every reading you have collected but not yet filed, meaning a check written this afternoon immediately validates the period you are about to report on. Crucially, reports that are already completed or verified are left strictly alone.
What a rule can catch
A rule can monitor a wide variety of data points, stretching far beyond basic threshold limits.
- Out-of-range readings: Measurements falling outside the bounds your methodology expects, on either the high or low end.
- Duplicate deliveries: The same delivery logged twice in one month—one of the easiest ways to accidentally over-report.
- Stuck integrations: A meter reporting far more frequently than it should, or feeding you the exact same figure over and over.
- Feedstock and moisture limits: Mass or volume readings that violate methodology allowances for a specific material.
- Drifting calculations: A calculated carbon intensity score or a credit output total landing outside your expected band, caught before it reaches a filing.
- Invalid values: A placeholder left in a tracking field, or a category tag that isn't valid for your specific reporting program.
The duplicate and frequency checks are often the hardest to find manually because they span multiple data points, which aren’t visible in a single, isolated reading. They only become obvious when evaluating patterns across a week or a month - something a rule can track on its own. The full expression reference is in our docs if you want to see exactly how far the logic can go.
Why data quality checks belong in your compliance platform
Most teams have already tried some version of this, whether through a custom script or a painful manual monthly review process. But three things fundamentally change when your quality checks live directly inside the compliance platform that already holds your data:
- It never forgets: The rule runs automatically on every reading as it arrives. It keeps running in the background without anyone needing to schedule it or remember to trigger it.
- Correcting a rule re-checks the data: If you set a threshold incorrectly, you just fix the rule. Mangrove immediately runs the corrected version back over the readings it already covered. Each version keeps its own findings, so you can clearly compare what the old check caught versus the new one.
- The flag follows the number: An alert raised at ingestion stays securely attached to that value all the way to the final report. The problem stays right in front of whoever is filing, instead of dying in an error log that nobody opens.
- Audit-ready transparency: A rule acts as a written, versioned statement of the exact checks your methodology requires. Every alert it raises is kept against the version of the rule that triggered it. When your team clears a flag, the reason is permanently stored alongside it. A reviewer can see exactly which check ran, what it found, and how every single finding was resolved.
Your compliance management and your revenue shouldn't depend on tired eyes or manual processes spotting a typo in row 4,000. By automating your data quality checks directly within your compliance platform, you eliminate the blind spots, protect your audit trail, and guarantee that a filed number is a verified number.
Flagging bad data is only half the story. Next up in Part 2 of our Assurance features, we’ll dive into automated data substitutions.